Skip to content

Platform & Sovereignty

Your sensors speak.
Your data stays yours.

VizO collects, analyses and restitutes water data: whatever the matrix, from catchment to discharge. On a standard protocol, with guaranteed ownership and portability: the exact opposite of technological captivity.

VizO live

The control room
for your water.

Network map, statistics, PFAS compliance, forecasts and an AI assistant, in a single console. Explore the views the way an operator would.

VizO LIVE

Compliance

%

Network yield

%

Leaks pre-located

Active sensors

Instrumented network

Nominal Watch Alert

Event stream

    Demonstration: simulated data for illustration. The real analysis engine applies the thresholds of the French Public Health Code and EU Directive 2020/2184.

    VizO, in the real world

    The platform as it runs today.

    The preview above is a stylised reconstruction of the control room. Here is the real platform, in production, on public Hub’Eau data: same engine, same rigour, eight screens.

    0

    Towns covered (Hub’Eau, updated continuously)

    0

    Analysis profiles: drinking water, ecosystems, groundwater, resource

    0

    Core sources: Hub’Eau, SISPEA, SANDRE, geo.api.gouv.fr, PubChem

    01

    Entry point

    The choice of analysis profile shapes the whole interface: drinking water, ecosystems, groundwater or resource.

    • 4 selectable analysis profiles (drinking water, ecosystems, groundwater, resource): each adapts the data sources used and the interface.
    • Natural-language search right from the home screen: ask a question without navigating menus.
    • Preloaded example towns (Caen, Rouen, Strasbourg, Bordeaux) to try the analysis immediately.
    • "My analyses": save your town to check its compliance in one click, on every visit.
    02

    Overview

    A summary view that always places the official verdict ahead of VizO’s own index.

    • Official ARS verdict shown first, VizO’s own index always second and labelled "analytical, not regulatory".
    • Key indicators at a glance: towns, analyses, compliance, PFAS analyses, maximum exceedance factor.
    • Alert banner on critical exceedances, naming the towns concerned directly.
    • Cross-rankings: most-affected towns and most-exceeded parameters, over the same period.
    03

    National map

    34,961 towns, one map, a reading that animates over time.

    • Thematic layers: Results, Analyses, PFAS, Focus — choropleth by criticality level, heatmap, clustering.
    • Time slider: replay the year-by-year evolution across the whole analysed territory.
    • Detailed popups: summary and associated health effects for every point, without changing view.
    • Sharing by link or QR code, PNG, CSV and GeoJSON export for reuse in a GIS.
    04

    Compliance & exceedances

    A prioritised register, not just a record: the worst first, with the actions to take.

    • Breakdown by risk level (critical, major, minor) and by pollutant family (pesticides, heavy metals, other).
    • Exceedance-factor distribution: spots the most severe gaps at a glance, not just the most frequent.
    • Monthly compliance-rate trend, to tell a lasting drift apart from a one-off spike.
    • Register of non-conformities, worst first, with an exportable, costed sampling plan.
    05

    Forecast & early warning

    Anticipate an exceedance, not just record it after the fact.

    • Holt-Winters smoothing (trend and seasonality), with automatic fallback to a robust Theil-Sen slope for short series.
    • Exceedance probability and estimated time to threshold breach, optimistic and pessimistic range.
    • Reliability measured by backtest (MAPE), shown next to the forecast rather than presented as a given.
    • Adjustable horizon from 3 to 24 months, simulatable trend scenario (acceleration or slowdown).
    06

    Territorial context

    Understand a potential cause, not just record an exceedance.

    • Cross-referenced with nearby industrial pressure: ICPE sites, Seveso sites, within a given radius.
    • Real-time VigiEau drought restrictions, down to the applicable prefectural order.
    • Geolocated potential pollution sources, with their regulatory regime (authorisation, registration, declaration).
    • Explicitly correlative reading: a co-occurrence never establishes causation on its own.
    07

    Reports & exports

    A unified document centre: what you read on screen restitutes as a report, with no reformatting.

    • PDF reports: executive (decision-makers), technical (experts), compliance, annual RPQS-style, town record (single or in bulk).
    • Optional AI-written analysis, injected at the top of the report (summary, points of attention, recommendations).
    • Scheduled reports: automatic monthly or quarterly delivery, no re-entry.
    • Data exports: CSV, multi-sheet Excel, GeoJSON for the map.
    08

    Compliance record

    The verdict at sample grain, not just an annual average.

    • ARS compliance calculated at sample grain, with the number of compliant and non-compliant samples.
    • Exceedances measured parameter by parameter, with the multiplication factor against the limit.
    • Distinction between measurements, exceedances and non-evaluable results: no false positives from threshold confusion.
    • Direct link to every town served by the distribution unit.

    The VizO platform

    Collect, analyse, restitute.

    A software platform that turns signal into decision: measurement aggregation, AI analysis, and open restitution. Regulatory reporting and extractions are included in the capability subscriptions.

    01

    Collection

    Aggregation of measurements from all sensors and formats, continuously, via the public LoRaWAN network.

    02

    AI analysis

    Anomaly detection, pre-location, virtual sensors: raw data becomes actionable information.

    03

    Restitution

    Dashboards, alerts, regulatory reporting and extractions, with no separate platform billing.

    04

    Interoperability

    Open REST / MQTT APIs, JSON / CSV formats, CMMS, GIS and telemetry interfaces.

    Who it’s for

    One platform, several professions.

    Every profile finds, on the same data foundation and the same analysis engine, the use that concerns it.

    Network operator

    Multi-DU operational monitoring, early alerts, 2026 PFAS anticipation, import of proprietary data.

    Laboratory

    Bulletin import, white-label reports and client portal, account management.

    Engineering firm

    Advanced analysis: statistics, correlations, forecasts, every tab open.

    Local authority

    Territorial steering, public-communication mode (A-to-E grade), comparison with neighbouring towns.

    End client

    A portal restricted to its own scope: compliance, documents filed by its provider, requests.

    The white-label lever

    A laboratory or operator can resell access to VizO to its own clients: custom branding, features activated à la carte, a dedicated portal (up to 50 towns per client), with no development.

    A project like this? See our expertise.

    What VizO does

    From raw measurement to an argued decision.

    Mapping, advanced statistics, regulatory compliance and forecasting in a single console, and everything restitutes as ready-to-share reports.

    MAPLIBRE

    Mapping

    Points and territories coloured by criticality, municipal choropleths, thematic layers (PFAS, pesticides, metals, microbiology), heatmaps and clustering.

    ADVANCED ANALYSES

    Advanced statistics

    Full descriptives, Pearson / Spearman correlations, percentiles, anomaly detection (Z-score), Mann-Kendall trend tests, searchable SANDRE reference.

    CSP · EU

    Compliance & exceedances

    CSP & EU 2020/2184 thresholds, transparency on the applied threshold source, town × parameter heatmap, recurrent exceedances.

    DIRECTIVE 2026

    PFAS: 2026 directive

    Compliance tracking from sanitary control and accredited laboratory bulletins: radar, Σ4 / Σ20 sums, rankings by compound, evolution.

    EARLY WARNING

    Forecast & early warning

    Holt-Winters smoothing (trend + seasonality), Theil-Sen fallback for short series, 95% confidence interval, exceedance probability and estimated time to threshold.

    EXPERT VIEW

    Expert view

    Water Quality Index (WQI), regulatory-tightening simulator, treatment-cost estimator, upstream / downstream model.

    AI

    AI assistant

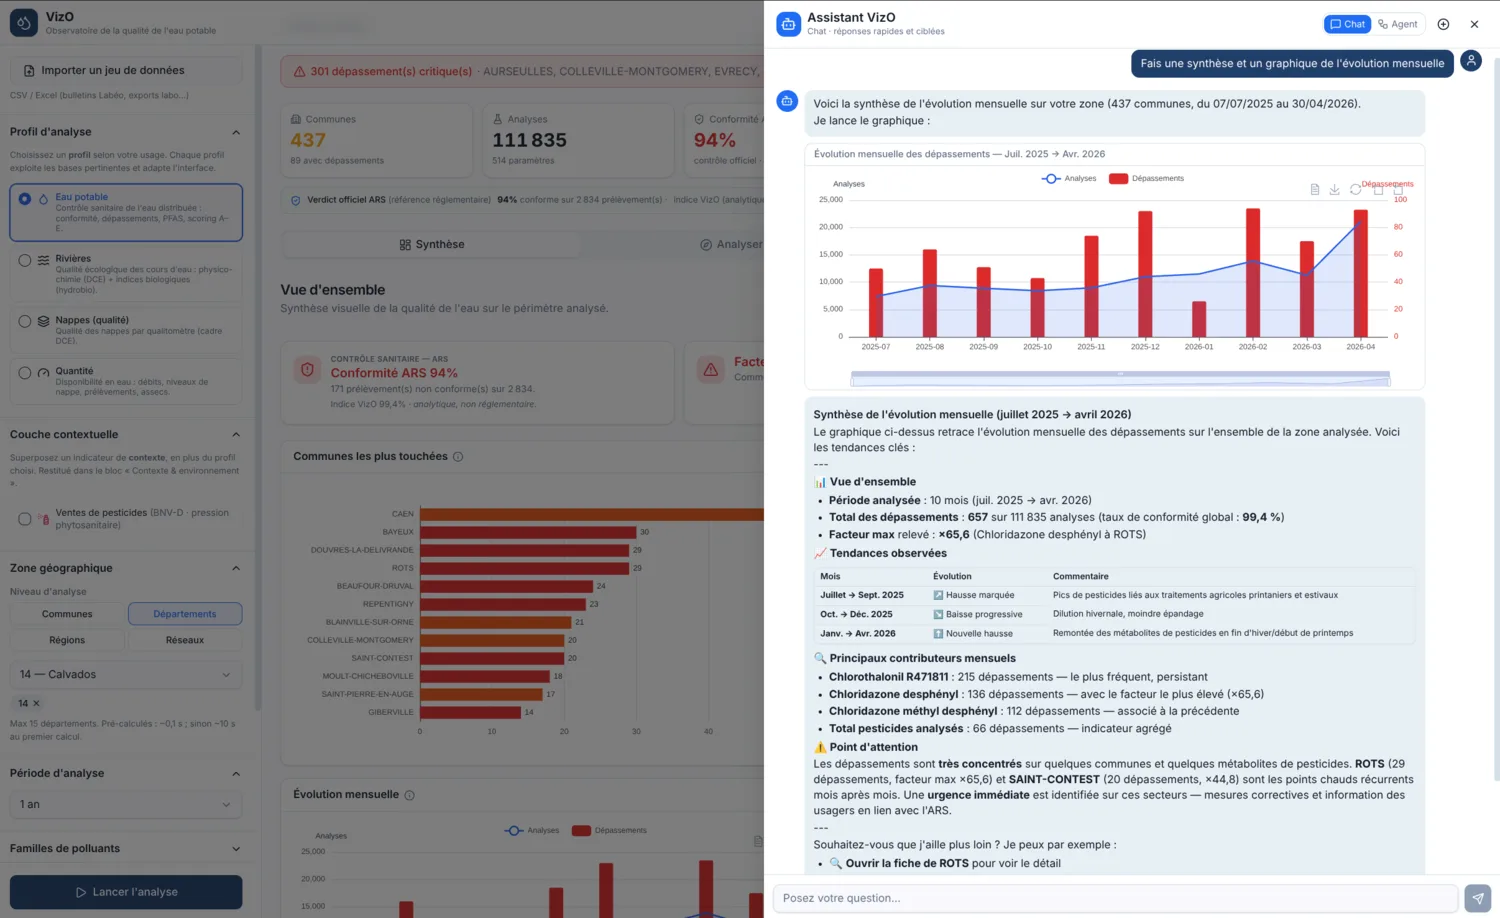
    Natural-language analysis, charts generated on demand in the chat, molecule cards with 2D structure, streaming answers.

    PDF · WHO/EPA

    Reports & standards

    Executive & technical PDF reports, multi-sheet CSV / Excel exports, comparison against WHO and US EPA standards.

    The VizO copilot

    An assistant that acts, not just answers.

    In natural language, the copilot executes real actions inside the application. It doesn’t just describe a data point: it opens it, filters it, restitutes it.

    • Opens a town’s record, switches tab, analysis profile or period.
    • Applies filters: parameter family, PFAS, exceedance factor.
    • Adds a town to Surveillance, creates a notification.
    • Generates and downloads a PDF report directly from the conversation.
    • Runs a full diagnostic (regulatory calendar, prioritised non-conformities, sampling plan) in a single request.
    • Consults territorial context and produces visualisations on demand.
    This chart and its summary were generated by the copilot, on request, inside the conversation.
    This chart and its summary were generated by the copilot, on request, inside the conversation.

    Methodological rigour

    The ARS stays the reference. Always.

    VizO never replaces an official verdict: it clarifies and anticipates it. Any method specific to VizO is explicit, versioned and presented as secondary.

    ARS compliance first

    VizO’s own indices are displayed next to the official verdict, never in its place.

    Threshold ≠ quantification limit

    A strict distinction between the regulatory threshold and the laboratory’s quantification limit, avoiding classic false positives (e.g. the 200 µg/L aluminium threshold confused with its ≈10 µg/L LQ).

    Explainable score

    The A-to-E quality score breaks down and justifies itself online, component by component: never a black box.

    Versioned thresholds

    Public Health Code and EU Directive 2020/2184, with traceability of the threshold source applied to every exceedance.

    Water matrices

    One platform, every water.

    The same sensor and the same analysis engine apply to every matrix: from catchment to discharge, from the tap to the shoreline. The regulatory context changes, never the technology.

    Drinking water

    Drinking

    Drinking water

    From catchment to tap: metals, nitrates, chlorine and organic matter at the sensor; PFAS and microbiology compliance tracked via the laboratory. Verdicts under the Public Health Code & EU Directive 2020/2184.

    metals · nitrates · chlorine

    Surface water & resource

    Surface

    Surface water & resource

    Rivers, reservoirs, raw-water intakes: upstream pressure, hydrobiology, seasonality and resource trends.

    Mann-Kendall trend

    Treatment & discharge

    Wastewater

    Treatment & discharge

    Plant inlet and outlet: loads, treatment yield, self-monitoring and discharge compliance.

    inlet → outlet

    Shellfish & coastal waters

    Shellfish

    Shellfish & coastal waters

    Production areas: microbiological quality, health-classification monitoring, early warning on contamination episodes.

    class A · B · C

    Bathing & public venues

    Pools

    Bathing & public venues

    Public and collective pools: disinfection, by-products (chloramines, THMs), pH: continuous monitoring rather than scattered readings.

    continuous monitoring

    Indicative list. The matrix sets the regulatory context and the applied thresholds, not the hardware architecture.

    Data chain

    From sensor to decision, with no captive intermediary.

    01

    Sensor

    Embedded measurement & analysis

    02

    LoRaWAN

    Standard public network

    03

    VizO

    Collection & AI

    04

    Restitution

    Dashboards · API · CMMS/GIS

    Sovereignty

    Five guarantees, not an argument.

    Control of operational data is decisive over a long concession. We embed it in the design, not in a promise.

    01

    Open protocol

    Natively standard LoRaWAN communication, integrable into the public network, with no proprietary protocol, unlike captive remote-reading.

    02

    Data ownership

    Data is owned by the authority, portable at any time. The hardware is an interoperable returnable asset.

    03

    Models in escrow

    Source code and AI models are deposited in escrow, triggered on failure: reversibility is structural.

    04

    Reversibility

    No captivity at the meter or the platform: at any time, the authority can take back control of its data and hardware.

    05

    Compliance

    Federated authentication (SSO), sessions revocable at any time (user, organisation or platform), per-organisation audit log: an approach aligned with ANSSI and CNIL recommendations.

    The contrast

    Sovereign, not captive.

    The difference is not visible on installation day. It is lived across the whole concession.

    Drop! platform

    • Protocol

      Standard LoRaWAN, public network

    • Data

      Owned by the authority, portable

    • Models & code

      Deposited in escrow

    • Capabilities

      Quality + hydraulics + metering

    • Reversibility

      Structural, at any time

    • Hardware

      Interoperable returnable asset

    Captive remote-reading

    • Protocol

      Proprietary protocol

    • Data

      Hosted by the outgoing operator

    • Models & code

      Black box

    • Capabilities

      Metering only

    • Reversibility

      Captivity at renewal

    • Hardware

      Lock-in at the meter

    What sets us apart

    Neither a probe, nor a laboratory, nor a black box.

    Drop! sits where others stop: continuous, multi-matrix vigilance that stays your property.

    01

    Versus point-in-time analyses

    The laboratory measures a few times a year, after the fact. Drop! watches continuously and directs accredited analysis to the right moment and place, without ever replacing it.

    02

    Versus single-parameter probes

    A probe means one parameter, one point, one silo. Drop! means a common hardware platform, several capabilities and matrices, AI analysis and a unified restitution.

    03

    Versus proprietary solutions

    Closed protocol, data hosted by the operator, black box. Drop!: standard LoRaWAN, portable data, models in escrow, structural reversibility.

    04

    Versus spreadsheets and exports

    The data exists but lies dormant. VizO applies the thresholds, detects trends, forecasts breaches and produces the report, automatically.

    Interoperability

    Fits into your information system.

    VizO does not replace your tools: it feeds them. Interfaces are specified jointly with your systems and those of the operator or authority.

    REST API MQTT JSON CSV CMMS GIS Telemetry Open data

    Next

    See the platform on your data.

    Demonstration on a reference site, interface scoping workshop: let’s organise the trial on your network.